> ## Documentation Index
> Fetch the complete documentation index at: https://docs.kadoa.com/llms.txt
> Use this file to discover all available pages before exploring further.
# Observability
> Reliability, throughput, and incident metrics for every workflow in your workspace
The [**Observability**](https://www.kadoa.com/observability) page in the left sidebar shows reliability, throughput, and incidents for every workflow in your workspace.
Pick a range of 30, 90, or 365 days. Headline numbers compare against the previous period, and **Export CSV** downloads the per-workflow table.
This page covers your workflows. For Kadoa platform availability, see [status.kadoa.com](https://status.kadoa.com).
## Success rate
One bar per day across the selected range.
* **Scheduled workflows**: the share of runs that completed successfully.
* **Real-time monitors**: monitor uptime. Run counts stay blank because polls are not runs.
* **Grey bar**: no data for that day.
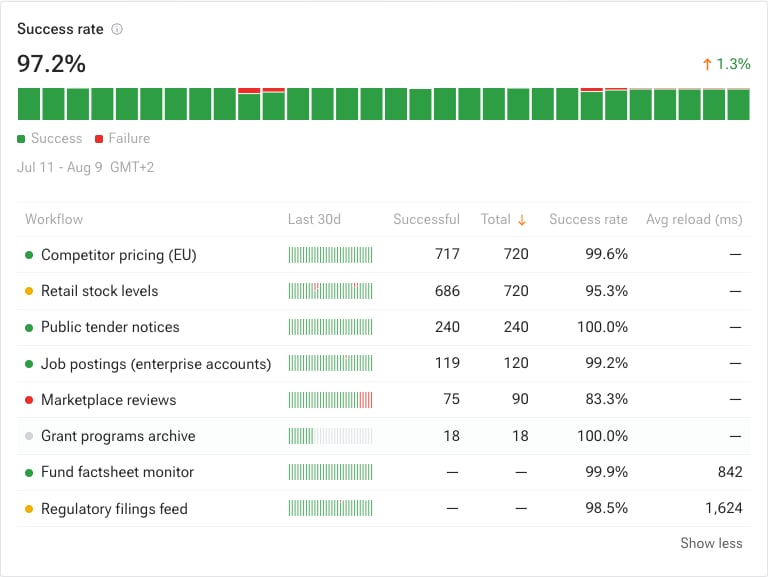 The table lists every workflow with its daily trend, run counts, and success rate. If your workspace has real-time monitors, an **Avg reload (ms)** column shows their average polling cycle time.
## Records delivered
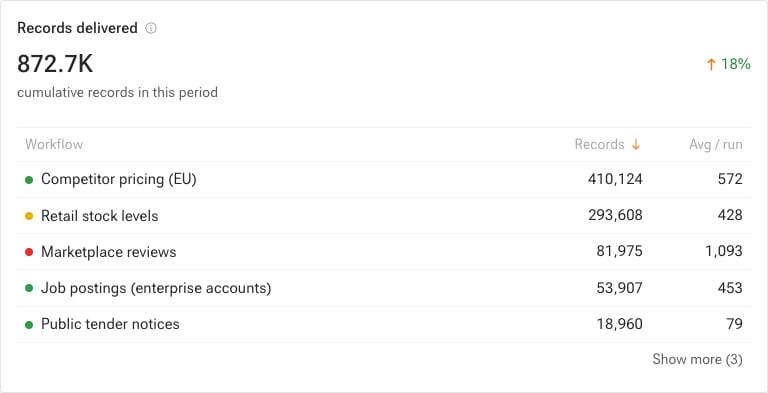
Cumulative rows delivered by completed runs, broken down per workflow with the average per run. Workflows that delivered nothing are listed too.
The table lists every workflow with its daily trend, run counts, and success rate. If your workspace has real-time monitors, an **Avg reload (ms)** column shows their average polling cycle time.
## Records delivered
Cumulative rows delivered by completed runs, broken down per workflow with the average per run. Workflows that delivered nothing are listed too.
 ## Tickets
Tickets are created automatically when a workflow fails, or manually by your team in the [Support Center](/docs/support-center).
## Tickets
Tickets are created automatically when a workflow fails, or manually by your team in the [Support Center](/docs/support-center).
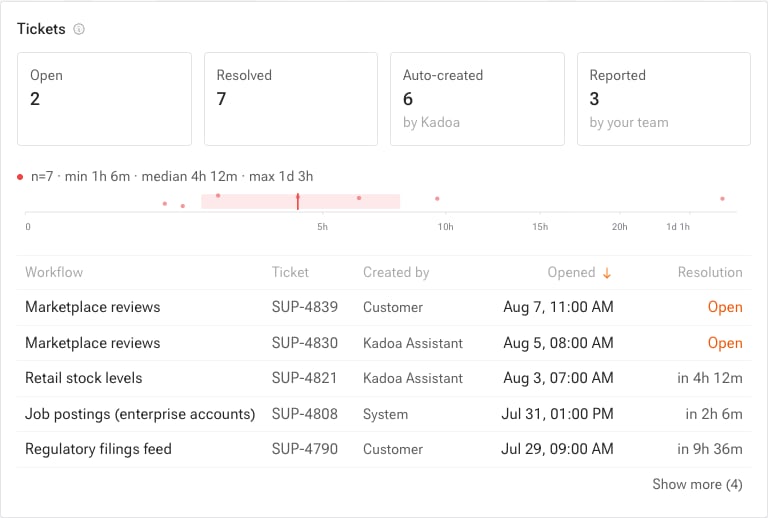 The distribution chart shows how long resolved tickets took. Click a ticket ID to open it.
## Mean time to recover
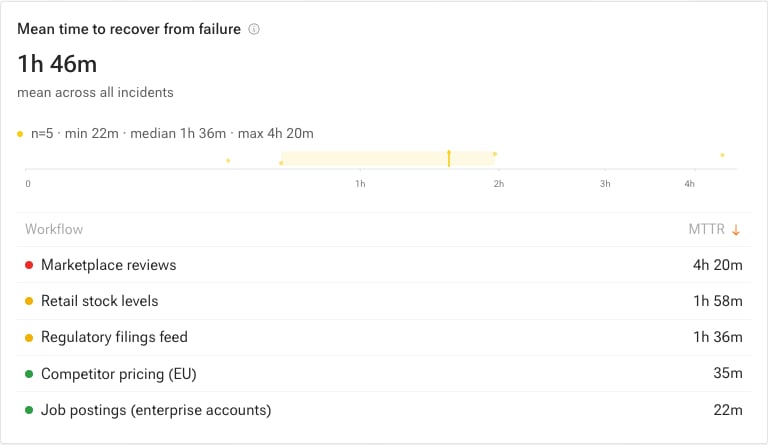
Average time between a workflow's first failure and its next successful run.
The distribution chart shows how long resolved tickets took. Click a ticket ID to open it.
## Mean time to recover
Average time between a workflow's first failure and its next successful run.
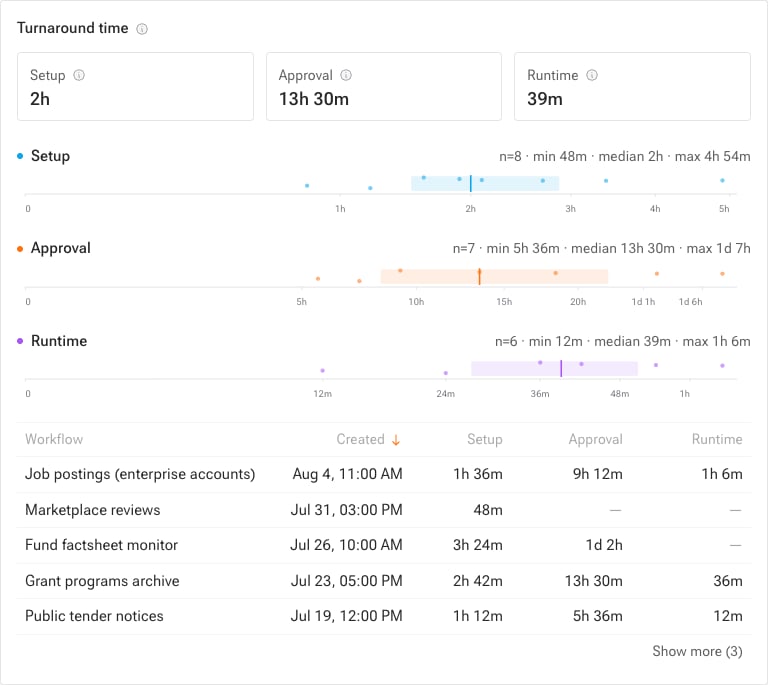
 ## Turnaround time
How long each recently created workflow took to get up and running, split into three phases:
| Phase | Measures |
| ------------ | -------------------------------------------------------- |
| **Setup** | Creating the workflow until its first successful preview |
| **Approval** | How long the preview waited for your team's approval |
| **Runtime** | Median duration of a completed production run |
## Turnaround time
How long each recently created workflow took to get up and running, split into three phases:
| Phase | Measures |
| ------------ | -------------------------------------------------------- |
| **Setup** | Creating the workflow until its first successful preview |
| **Approval** | How long the preview waited for your team's approval |
| **Runtime** | Median duration of a completed production run |
 ## Send this data to your own stack
You can mirror everything on this page into your own observability tooling or data warehouse.
### Events
Subscribe to the [workflow events](/docs/notifications#event-types) you care about, including run failures and data changes.
Push them with [webhooks](/docs/integrations/webhooks) or [websockets](/docs/integrations/websockets), or pull them with the [REST API](/docs/integrations/rest-api). Example payloads and available fields are in the [payload reference](/docs/integrations/webhooks#payload-reference).
### Aggregated metrics
We can deliver the aggregated metrics shown on this page to your cloud storage bucket on a schedule, ready to load into Snowflake, BigQuery, Databricks, or Redshift. See [Cloud Storage](/docs/integrations/cloud-storage) for the ingestion patterns, and request setup through the [Support Center](/docs/support-center).
## Learn more
* [Notifications](/docs/notifications)
* [Data quality](/docs/data-quality)
* [Support Center](/docs/support-center)
## Send this data to your own stack
You can mirror everything on this page into your own observability tooling or data warehouse.
### Events
Subscribe to the [workflow events](/docs/notifications#event-types) you care about, including run failures and data changes.
Push them with [webhooks](/docs/integrations/webhooks) or [websockets](/docs/integrations/websockets), or pull them with the [REST API](/docs/integrations/rest-api). Example payloads and available fields are in the [payload reference](/docs/integrations/webhooks#payload-reference).
### Aggregated metrics
We can deliver the aggregated metrics shown on this page to your cloud storage bucket on a schedule, ready to load into Snowflake, BigQuery, Databricks, or Redshift. See [Cloud Storage](/docs/integrations/cloud-storage) for the ingestion patterns, and request setup through the [Support Center](/docs/support-center).
## Learn more
* [Notifications](/docs/notifications)
* [Data quality](/docs/data-quality)
* [Support Center](/docs/support-center)