Understanding Runs vs Workflows
- Run: A single execution of your workflow at a scheduled time
- Workflow: The configuration that schedules and manages runs
Error Handling
Every failed run tells you whether the issue is with the website, with Kadoa, or with the data itself. Kadoa uses a multi-layer approach to handle issues automatically:1. Self-Healing (Automatic)
Our AI adapts to changes without intervention:- Detects page structure changes and updates selectors
- Adjusts to new layouts and UI elements
- Retries with different strategies when extraction fails
- Agent investigates any issues automatically
2. Human Investigation (Manual)
For complex issues that can’t auto-recover:- A Support ticket gets created and our ops team investigates
- You’re notified about the failure via email and dashboard
- Fixes are applied until workflow runs successfully again
- You’re notified about the recovery and support ticket gets resolved
Error Format
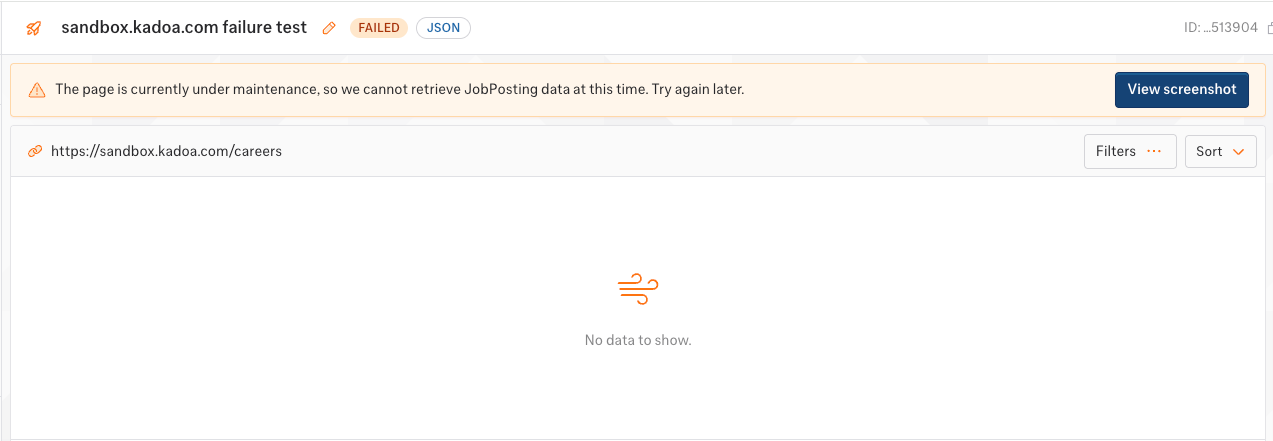
Errors are returned per run in the history endpoint:What Happens When Errors Occur
- Run marked as FAILED - visible in the dashboard and API
- You’re notified - if you’ve subscribed to
workflow_failedevents (see below) - Kadoa retries automatically - self-healing technology attempts recovery on the next run
- Ops team is notified - critical errors are flagged for investigation
- Submit a support request - use the Support Center for expedited help
Get Notified About Failures
Don’t poll the dashboard. Set up notifications so failures come to you. Subscribe to Workflow health events (workflow_failed) via the dashboard or API. This covers both failures and recoveries. Choose your channel:
You can also subscribe to
workflow_finished and workflow_data_change events. See Notifications for the full setup guide.
Track Run History
Every workflow keeps a full history of runs. Use it to spot patterns like intermittent blocks, declining record counts, or degraded performance.- Status:
FINISHED,FAILED,IN_PROGRESS,VALIDATING - Timestamps:
startedAt,finishedAt - Records extracted: row count
- Screenshot: what the page looked like during extraction
- Errors: full error details with context